Data processing
VLF transmitters signals in the seismic regions - statistical studies
Signal Global Maps - first step of data analysing process, which gives the full view of radio signal emission in the VLF range, show the localization of known radio transmitters and intensity of their signal.
Analysed data contain spectrum in the frequency range from 10 kHz up to 20
kHz. The difference between two spectral points is 19.5 Hz. However, there are
some gaps in data base, so instead of 512 spectral points, we use 204. For analyses we can use separately up-going and down-going orbits. However, due to strong
electromagnetic noises, we use only down-going orbits.
Problem: Which way is the most appropriate to show changes, turbulence anomalies in the signal transmitted from the ground, and registered by DEMETER ?
Main task: DEFINE MOST SUITABLE PARAMETER
S parameter
 The simplest way is to present the relative value of registration,
but this method is very unstable. It shows all changes in signal and
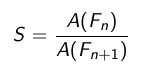
this may lead to wrong conclusion. We decide to make the simple
ratio of two amplitudes with neighboring frequencies, because this
may show such changes like dispersion. In fact, terms A(Fn) and A(Fn+1), represent logarithmic value of signal spectral density.
The simplest way is to present the relative value of registration,
but this method is very unstable. It shows all changes in signal and
this may lead to wrong conclusion. We decide to make the simple
ratio of two amplitudes with neighboring frequencies, because this
may show such changes like dispersion. In fact, terms A(Fn) and A(Fn+1), represent logarithmic value of signal spectral density.
There is wide variety of definitions, but
question which parameter is the best, has still no answer.
However, formula with simple ratio S, in a very good way shows the range of frequencies for one particular station, when signal
intensity is increasing, decreasing and when it achieves the
maximum.
To present the difference, we recommend to compare short animation made for NWC station in Australia.
Left panel: S parameter. Right panel: absolute signal value.